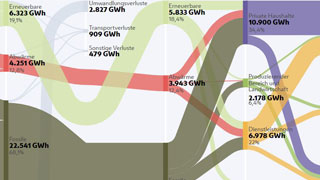
Energy consumption and energy flows in Vienna
The energy flow chart of the City of Vienna shows how much energy is required to supply the city, and where it is finally used.

A dynamic animation allows users to watch the distribution of the individual energy vectors through the entire energy flow chart, from gross inland energy consumption to use by final customers, and to understand the transformation, losses, and distribution among individual sectors. The tour shows the main stages of the energy flow process. This is complemented by a glossary that explains energy terminology in simple terms. All data are available for 2005 to 2016.
The dynamic energy flow chart is available in German and in English for both desktop and mobile screens.
The energy mix of the City of Vienna
The energy flow chart shows a clear dominance of fossil energy sources in the city's energy mix. Approximately half of the natural gas required is used to generate electric energy and district heating; the rest is used directly for heating. Fuels and mineral oils (petrol, diesel, and other petroleum products), on the other hand, are used nearly exclusively by the largest consumption sector, transportation.
wien.gv.at-English Edition
Contact form
