Introduction

The climate crisis in Vienna – Indicators highlight changes

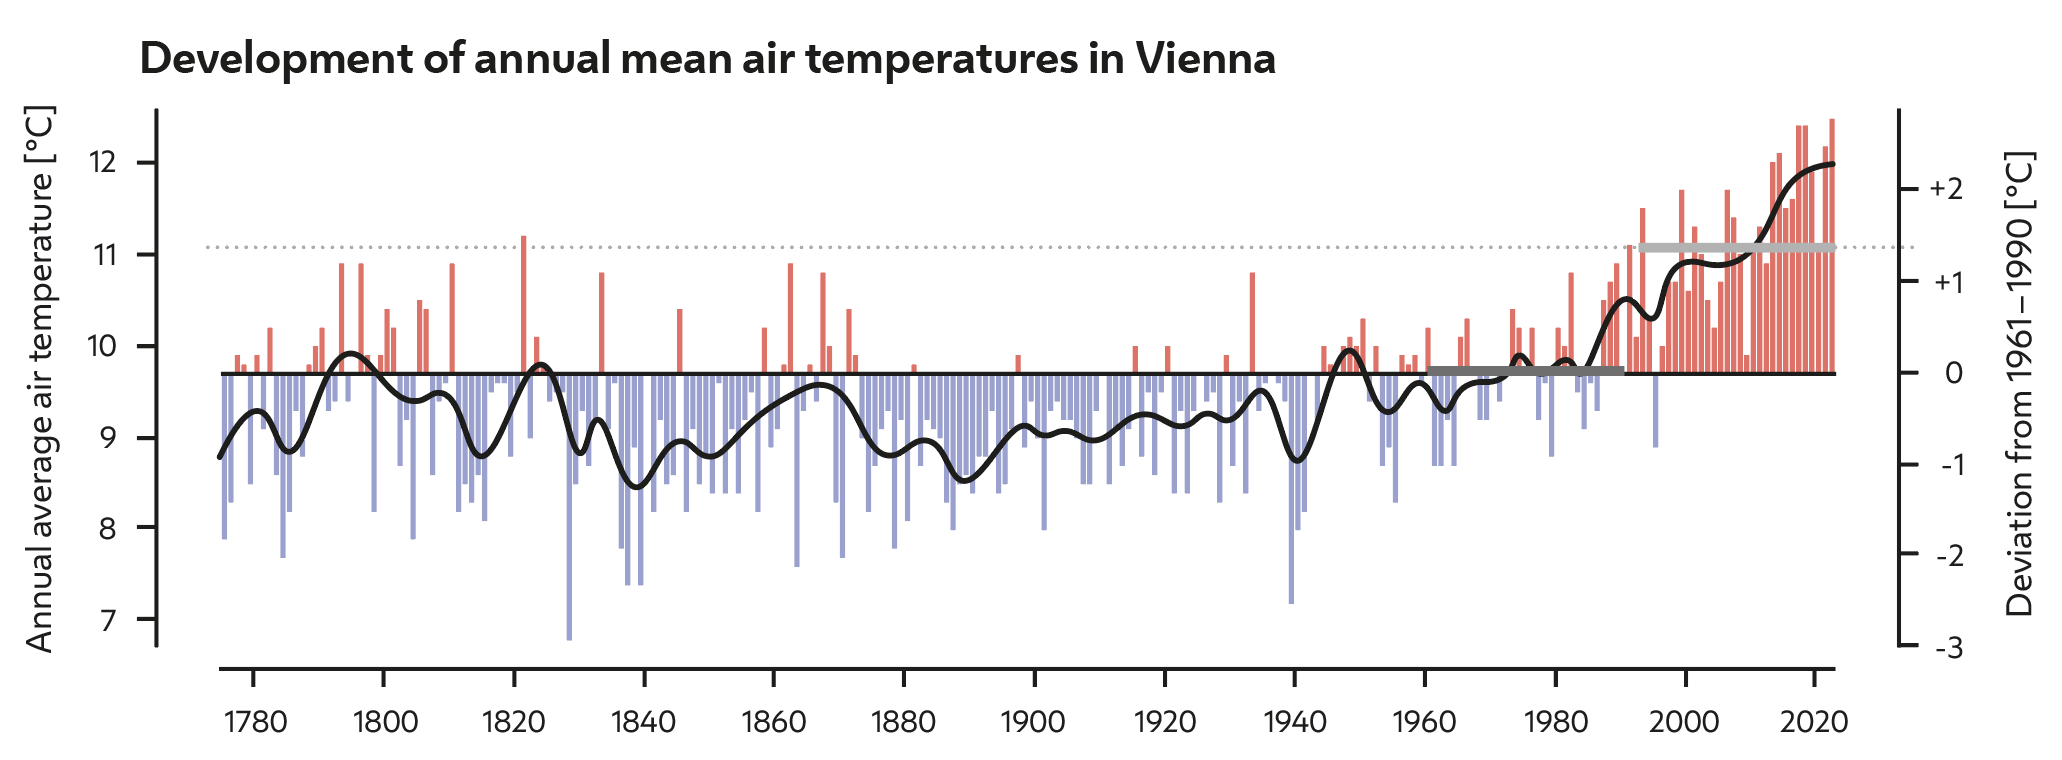
Our climate is getting warmer and more extreme. Since the 1970s, the annual mean air temperatures in Vienna have increased by close to three degrees Celsius. All of the ten warmest years on record occurred after 2000.

The year 2023 was the hottest ever recorded in Vienna since temperature measurements began nearly two and a half centuries ago. No previous autumn was as warm. From June to September, four heat waves occurred, two of which lasted up to 18 days. 2024 once more confirmed the trend towards an increasingly warm climate. The people in Vienna experienced the hottest summer on record with 45 very hot days.

Development of annual mean air temperatures in Vienna
Time series diagram, with the years 1780-2022 on the x-axis and the annual mean values of the air temperature between 7 and 12 °C, which run in the diagram in the form of a black line over the years, on the y-axis. In addition, the mean value for the years 1961-1990 is plotted as a straight black line along the entire time axis and the deviations from this mean value for each year are shown in the form of a red bar for a positive deviation from the mean value or a blue bar for a negative deviation from the mean value. It can be seen that while the years 1780 to 1980 or 1990 are dominated by negative deviations from the mean value for the period 1961-1990, it was colder than this average in these years. From 1990 onwards, red bars dominate, meaning that it was warmer than the average for the period 1961-1990. The black line, which shows the annual average air temperature, also rises as a result. In addition, the red bars become increasingly higher over the course of the time axis from 1990 onwards, meaning that the deviation from the 1961-1990 average increases and the annual mean temperature rises.
Figure 1: Climate review. Deviation of annual mean air temperatures from the long-term average for the period 1961-1990 in degrees Celsius. The levels of the mean values in the reference periods 1961-1990 and 1993-2022 are rendered as dark grey and, respectively, light grey lines.1

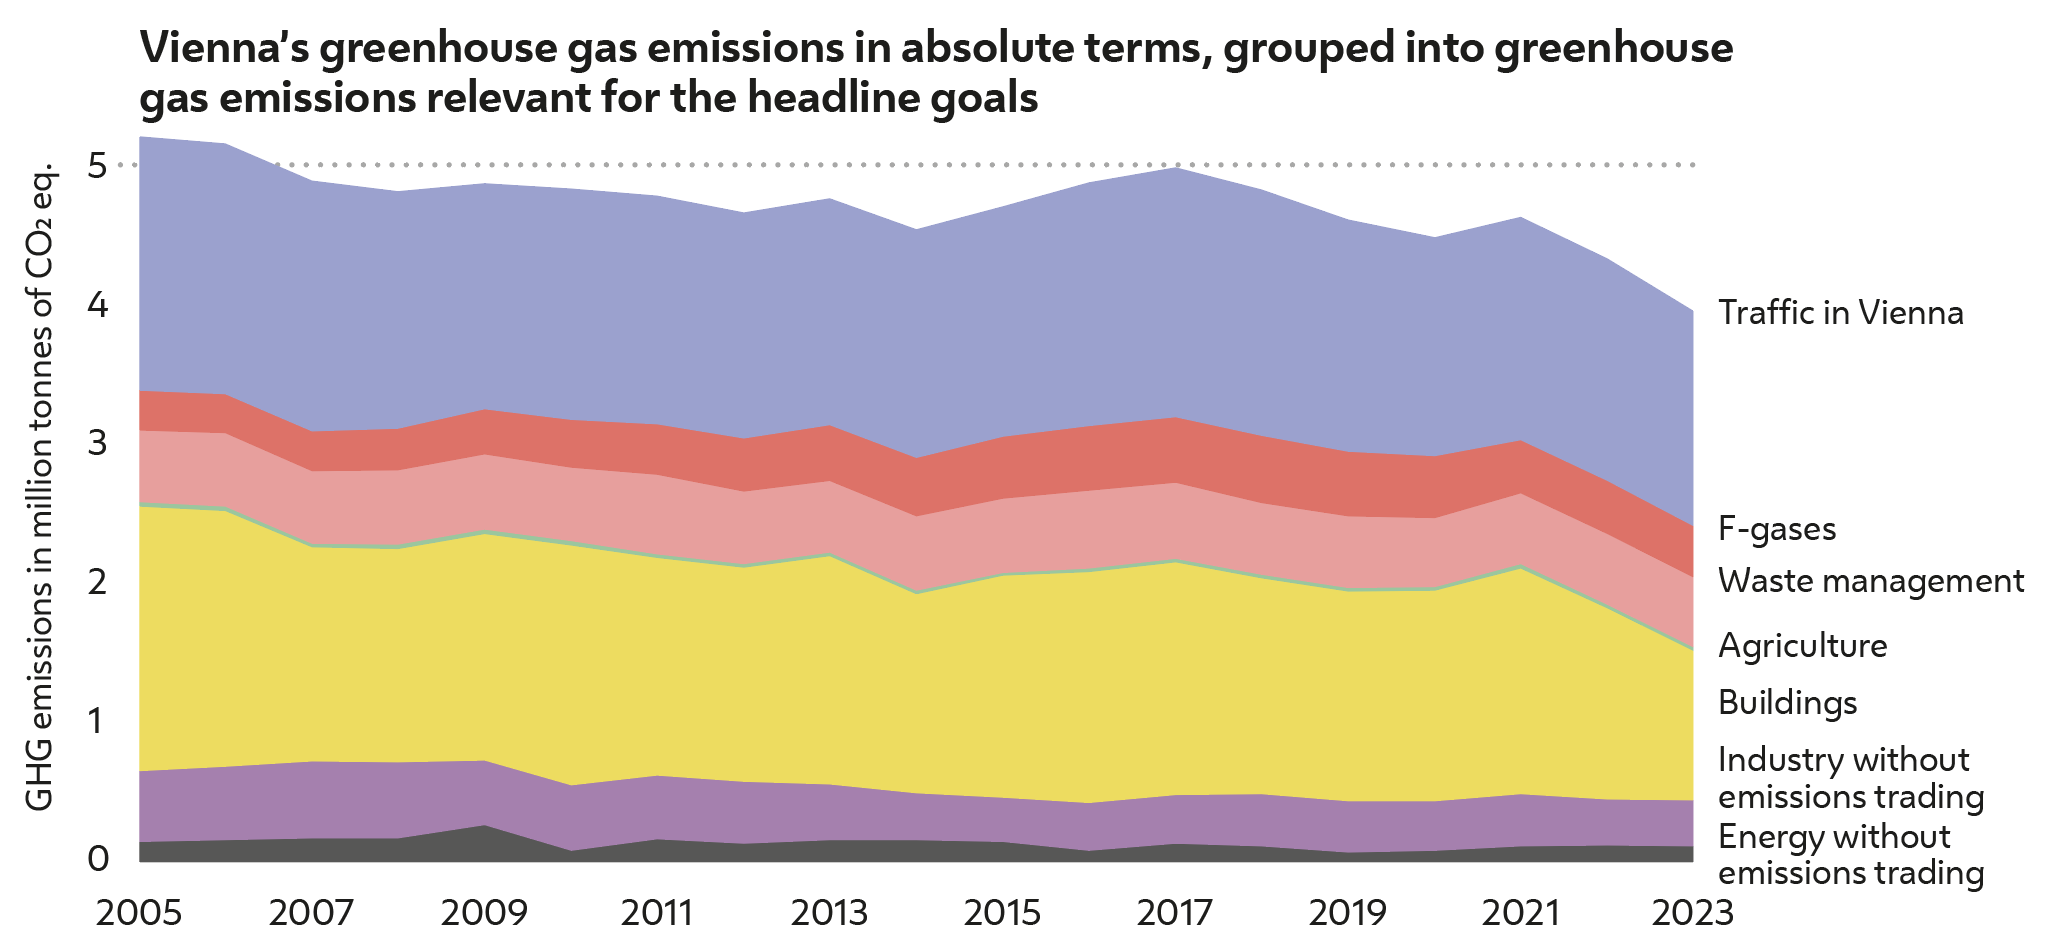
Since 2005, the City of Vienna has been able to reduce the total emission volume in absolute terms by nearly one third (31%) (as of 2023). Compared with the previous year 2022, 2023 presents a reduction of total emissions of about 11%. In absolute terms, greenhouse gas emissions relevant for the headline goals as defined by the Vienna Climate Guide decreased by close to one quarter (24%) between 2005 and 2023 and by 8.7% compared with the previous year 2022.

Vienna’s greenhouse gas emissions in absolute terms, grouped into greenhouse gas emissions relevant for the headline goals
Area diagram: Greenhouse gas emissions in million tons of CO2 equivalents for various sectors in the years 2005 to 2023. The absolute values are shown for the transport, F-gases, waste management, agriculture, buildings, industry without emissions trading and energy without emissions trading sectors. The transport and buildings sectors emit the largest millions of tons of CO2 equivalent. Energy without emissions trading emits the least. The sum of the sectors also shows the total value of Vienna's greenhouse gas emissions, which have fallen from just over 5 million tons of CO2 equivalent to around 4 million tons of CO2 equivalent since 2005. All sectors have decreased, especially since 2021; only the industry sector without emissions trading has remained almost the same.
Figure 2: Summary representation in absolute terms and by sectors of the overall development of Vienna’s greenhouse gas emissions relevant for the headline goals, stated in million tonnes of CO2 equivalents. Development in absolute terms for the period 2005-2023; own chart based on the Environment Agency Austria (UIV)’s pollutant inventory for Austria’s federal provinces as well as on calculations by UIV.2