All results for Vienna
Elections to the Vienna City Council 2005
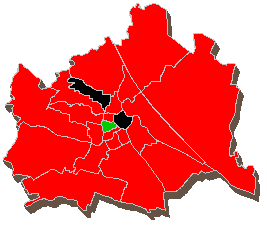
Strongest party per district
| |||||||||||||||||||||||||||||||||||||||||||||||||||||||||||||||||||||||||||||||||||||||||||||||||||||
- All results for Vienna
- Vienna (chart)
- Vienna (table)
- Constituencies
- Zentrum
- Innen-West
- Leopoldstadt
- Landstraße
- Favoriten
- Simmering
- Meidling
- Hietzing
- Penzing
- Rudolfsheim-Fünfhaus
- Ottakring
- Hernals
- Währing
- Döbling
- Brigittenau
- Floridsdorf
- Donaustadt
- Liesing
- Polling districts
- Innere Stadt
- Leopoldstadt
- Landstraße
- Wieden
- Margareten
- Mariahilf
- Neubau
- Josefstadt
- Alsergrund
- Favoriten
- Simmering
- Meidling
- Hietzing
- Penzing
- Rudolfsheim-Fünfhaus
- Ottakring
- Hernals
- Währing
- Döbling
- Brigittenau
- Floridsdorf
- Donaustadt
- Liesing
- Download raw data
- Results including all regional constituencies (12-KB-Excel)
- Local electoral ward (404-KB-Excel)
- Description of data
- Other elections
- Results of previous elections
City of Vienna | Elections and Specific Legal Affairs
Contact form